

Every mountain forecast eventually comes down to the same question: what will it be like up there, on the bit of hill I'm actually going to be standing on? A summit forecast gives you one point. A weather map gives you an area seen from above. Neither shows you the mountain itself.
So for v2.5.2 we built Profile 3D: a 3D model of the mountain with the weather drawn across the terrain, hour by hour. Pick up the hill, turn it round, zoom into the corrie you're planning to climb, and watch the wind, rain, snow, cloud and freezing level move across it through the day. It's available for every one of the 11,500+ hills and mountains we cover across the UK and Ireland.
Explore Profile 3DFive layers, one mountain
Open Profile 3D from the Profile 3D button next to Profile 2D on any hill's Weather Visuals page, then tap Layers to choose what you're looking at.
Wind
Animated wind flow across the whole mountain, with the terrain coloured by wind speed. This is where the 3D view really earns its keep: turn the hill round and you can see which slopes take the full force and which sit in the lee. Under the model you get the summit wind, gusts, and how variable the wind is across the terrain.
Precipitation & Snow Line
Rain, sleet and snow drawn at each height relative to the freezing level, and coloured by intensity. It's common in the hills for it to be raining in the glen, sleeting on the shoulder and snowing on the summit, all in the same hour, and here you can see exactly where each one starts. On days with lying snow, the Snow Line button switches to a view of where snow is calculated to be lying on the mountain.
Temperature
The temperature at every height, from the valley floor to the summit, with the colours set to suit the day's range so even a few degrees of difference stands out.
Cloud Cover
The cloud base is drawn as a layer across the mountain, and the ground inside the cloud is shaded as hill fog. Will the summit be clear by lunchtime, or are you navigating in the clag all day? Move the slider and find out. The Base and Coverage buttons turn each part on and off.
Freezing Level
A sheet at the freezing level height, with the ground above it, below 0°C, showing through. For winter walking and climbing it's one of the most useful things to know, and much easier to grasp as a surface cutting through the hill than as a number. It's available on days where the forecast includes freezing level data, usually the next two or three days.
Made to be handled
Drag to rotate the mountain, pinch to zoom, and double-tap to put it back where it started. Turn your device, or tap the landscape button at the top, for a larger view.
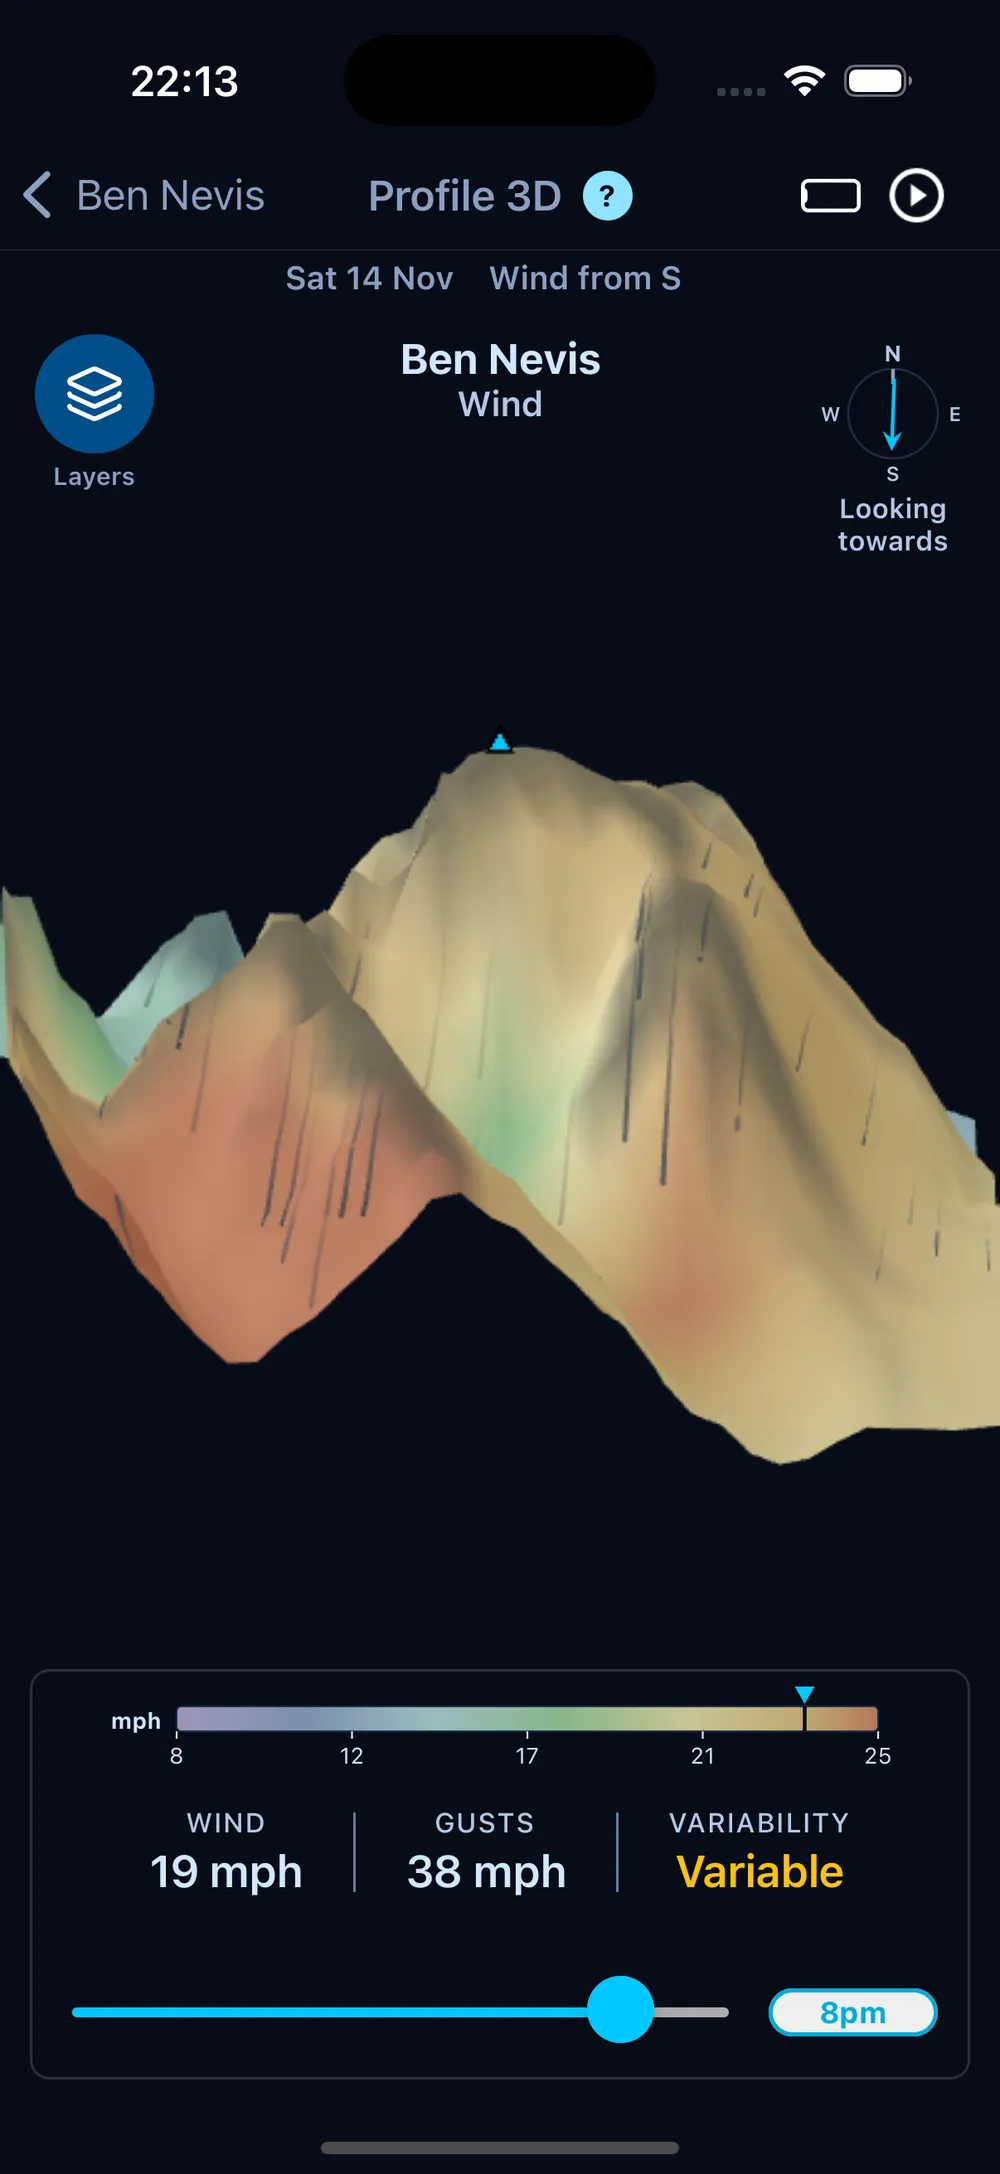
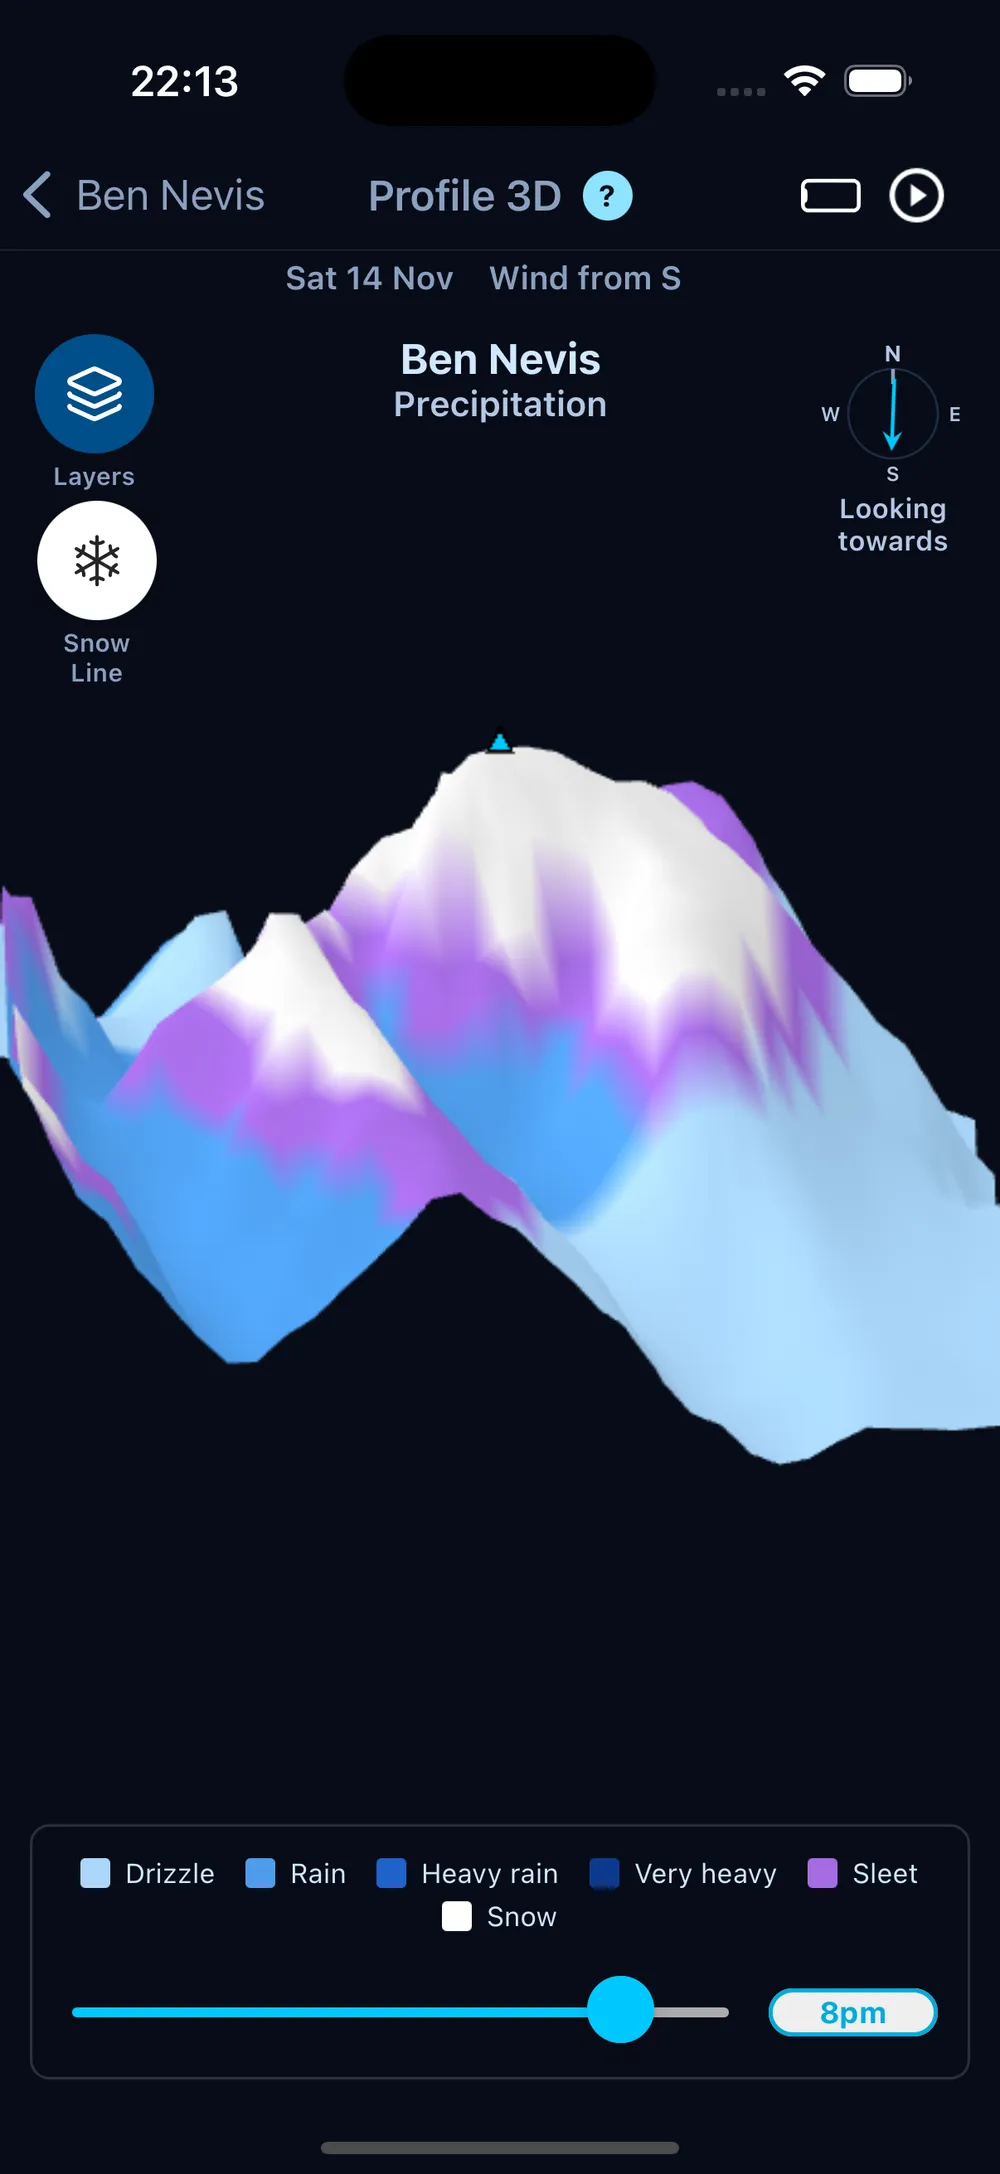
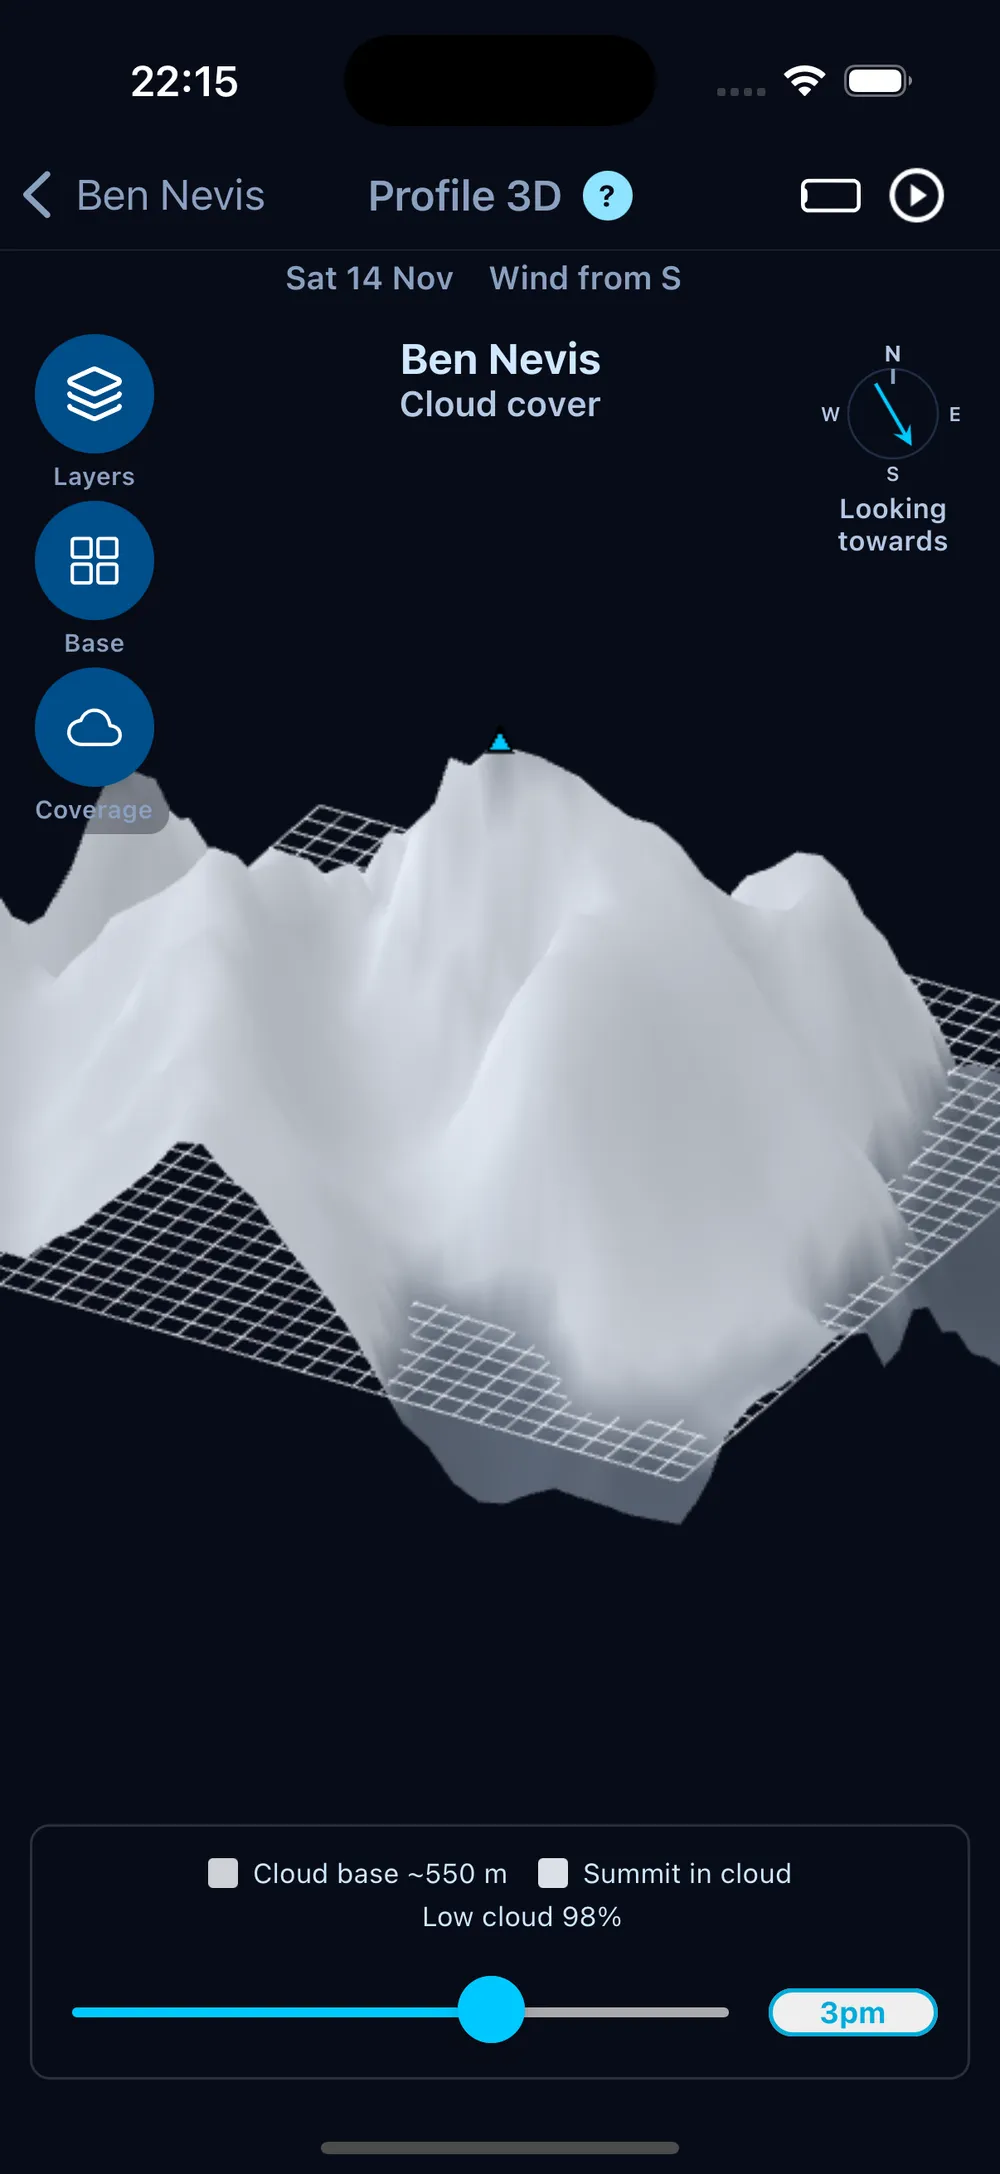
We spent a good while on the layout, so that the model gets as much of the screen as possible. The keys, stats and time slider sit on translucent panels over the terrain, so you can zoom right in and the mountain spreads out underneath them while everything stays readable. The view also starts from the north-north-east rather than square on. Seen a quarter-turn off, the model shows two sides of the hill and its ridges have real depth, and west and east stay on the same sides as in the 2D Weather Profile.
Wind Terrain, refocused
With the 3D wind view now living in Profile 3D, Wind Terrain has become a page about the summit wind through the day. It shows:
- Walking conditions, from Calm and Breezy through Hard going and Difficult to stand to Dangerous.
- Wind direction through the day.
- Variability: how much the wind changes across the terrain.
- Gustiness: how gusty it is compared with the mean wind.
- Wind chill.
- Wind by height: high ground, mid slopes and valley.
The time slider lines up with the hours on the charts, so the thumb sits right over the hour you're reading.
Free to try
Profile 3D, Wind Terrain and the Weather Profiles are now open to everyone. Free users see the current hour on every layer, and Pro lets you move through the whole day.
Behind the scenes
The first version of the terrain wind map, in v2.5.1, was drawn with SVG: a few hundred flat shapes in a fixed isometric view, painted back to front. It looked good, but it could never turn. The back-to-front order only works from one angle, and redrawing every shape on every frame of a spin is far more than a phone wants to do.
So Roy rebuilt it on WebGPU, the modern graphics interface that now runs inside the app on both iPhone and Android. The terrain is a real 3D mesh built from the elevation grid, the GPU works out what's in front of what, and the weather is coloured onto the surface. That's what makes it possible to pick the mountain up and look at the lee side, which was the whole point.
Each hill's model is built from a grid of elevation points around its summit, served from our own API and cached on your phone, so a hill you've looked at before opens straight away. That's how every one of the 11,500+ hills gets a model of its own, not just the famous few.
For more on how the wider visuals suite renders on your device, see Why Our New Weather Visualisations Are Built Differently.
Explore Profile 3D